Skip to content
I AM A:
TEACHER
SCHOOL LEADER
SYSTEM LEADER
+1 (619) 768-2752
Resources
search
About
About
About
Our Team
Board
Contact
About
Our Team
Board
Contact
Opportunities
Events
Opportunities Guide
Events
Opportunities Guide
Educator Resources
HTH Unboxed
Newsletter
HTH Unboxed
Newsletter
About
About
Our Team
Board
Contact
About
Our Team
Board
Contact
Opportunities
Events
Opportunities Guide
Events
Opportunities Guide
Educator Resources
HTH Unboxed
Newsletter
HTH Unboxed
Newsletter
Credential &
Degree Programs
learn more about
Credential & Degree Programs Overview
M.Ed. in Educational Leadership
Preliminary Administrative Services Credential
San Diego Teacher Residency
Financial Aid & Funding
Digital Portfolios
Institutional Review Board
Credential & Degree Programs Overview
M.Ed. in Educational Leadership
Preliminary Administrative Services Credential
San Diego Teacher Residency
Financial Aid & Funding
Digital Portfolios
Institutional Review Board
Professional
Development
overview
Professional Development
Project-Based Learning
Deeper Learning
Professional Development
Project-Based Learning
Deeper Learning
partner with us
Center for Love & Justice
Deeper Learning Global
PBL Leadership Academy
Center for Love & Justice
Deeper Learning Global
PBL Leadership Academy
partner with us
Center for Love & Justice
Deeper Learning Global
PBL Leadership Academy
Center for Love & Justice
Deeper Learning Global
PBL Leadership Academy
events
Continuous Improvement 101
Curated Visits
Deeper Learning Conference
Equity Stances for Educators
PBL Design Camp
National Summit on Improvement in Education
All Events
Continuous Improvement 101
Curated Visits
Deeper Learning Conference
Equity Stances for Educators
PBL Design Camp
National Summit on Improvement in Education
All Events
Continuous
Improvement
About
National Coalition for Improvement in Education
National Summit on Improvement in Education
Events & Trainings
National Coalition for Improvement in Education
National Summit on Improvement in Education
Events & Trainings
Networks
RAISE Chronic Absenteeism
Meta Attendance & Engagement
CARPE College Access
California District Math Curriculum and Instruction Network
Math Curriculum Implementation & Impact Network
RAISE Chronic Absenteeism
Meta Attendance & Engagement
CARPE College Access
California District Math Curriculum and Instruction Network
Math Curriculum Implementation & Impact Network
learn more about
Continuous Improvement
National Coalition for Improvement in Education [OLD]
CARE On-Track Network
CARPE College Access Network
District Math Network
Continuous Improvement
National Coalition for Improvement in Education [OLD]
CARE On-Track Network
CARPE College Access Network
District Math Network
Get Started
About
Credential &
Degree Programs
Professional
Development
Continuous
Improvement
Get Started
SEARCH
Robert Kuhl
2012
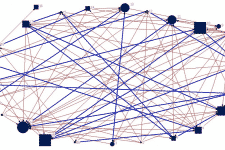
“How do teachers and students foster peer advising relationships and how do these advising networks impact student learning?”
publications
Article
The Six Relationships that Characterize Great Schools
Robert Kuhl
Skip to content
Open toolbar
Accessibility Tools
Accessibility Tools
Increase Text
Increase Text
Decrease Text
Decrease Text
Grayscale
Grayscale
High Contrast
High Contrast
Negative Contrast
Negative Contrast
Light Background
Light Background
Links Underline
Links Underline
Readable Font
Readable Font
Reset
Reset