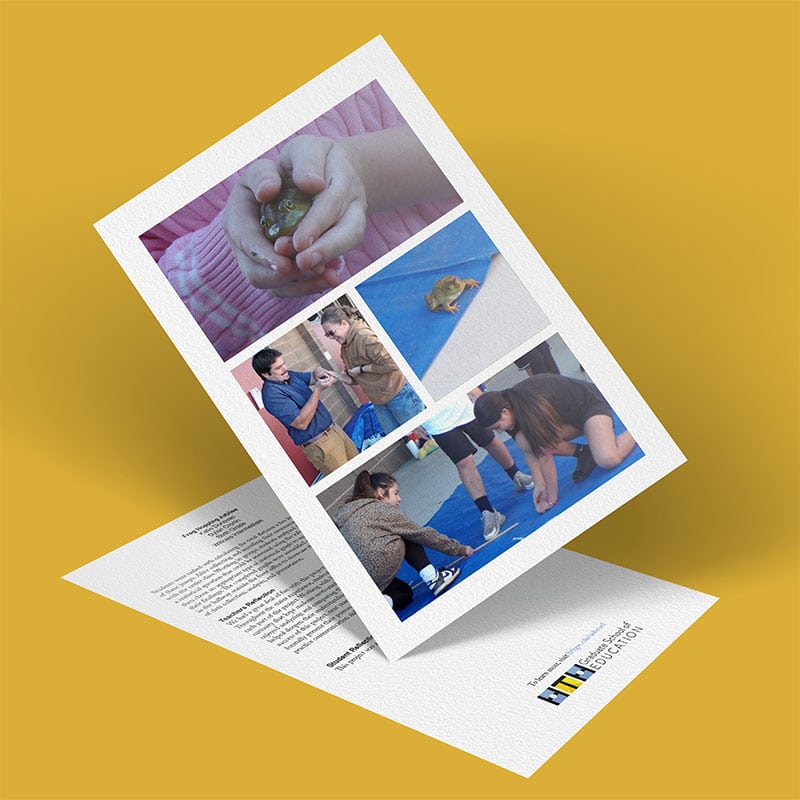
Students were tasked with calculating the total distance a live frog jumped over the course of three jumps. After collecting and recording their measurements, the data was shared with the entire class. Working in groups, students analyzed the class data and developed a statistical question that could be answered using the information collected. Each group then chose an appropriate type of statistical graph to represent the data and clearly display their findings. The completed graphs were assembled onto posters, which were displayed in the hallway outside the front office to showcase the students’ work and understanding of data collection, analysis, and presentation.
Teachers Reflection
We had a great deal of fun with this project, and we believe the students did as well. Throughout the entire experience, students remained engaged and enthusiastic about each part of the project. Working with live frogs added an extra level of excitement and curiosity that kept students motivated and eager to participate. The students especially enjoyed analyzing and comparing the data collected from the different classes, which helped deepen their understanding of statistics and data interpretation. Based on the success of this project, next year we plan to take it a step further by having students formally present their posters to another grade level, giving them an opportunity to practice communication skills while sharing their learning with a broader audience.
—Katie Donovan & Dylan Cronin
Student Reflection
This project was a lot of work but we had fun completing the challenge.