Jacobē Bell and Reshma Ramkellawan are alumni of the Improvement for Equity by Design Network at HTHGSE.
In January 2020, the Teaching Matters Network for School Improvement (TMNSI)—a coalition of 16 middle schools in New York City focused on improving college and career readiness for Black, Latine, and low-income students—observed that English Language Arts (ELA) proficiency scores for these groups were increasing at a significantly slower rate than their peers across the city.
After spending three months studying the problem in-depth, the TMNSI schools decided to test a change idea1 they called “Identity Questions,” in which ELA teachers ask students questions that connect their personal and cultural identity to the academic content at key junctures in their lessons. Research shows that when students see their identities reflected in texts or activities, they connect more deeply with reading and writing, leading to improved learning outcomes (Gay, 2018). In this way, culturally responsive teaching fosters confidence and critical thinking, which are essential for literacy development (Ladson-Billings, 1995).
Our theory of action postulates that these changes in students’ classroom experiences would be associated with changes in their ELA outcomes. Multiple findings suggest our theory of action holds up:
While our results are not based on randomization (and thus differences observed cannot be construed as causal), the outcomes described above add to the body of knowledge demonstrating that centering student identity can positively impact academic performance.
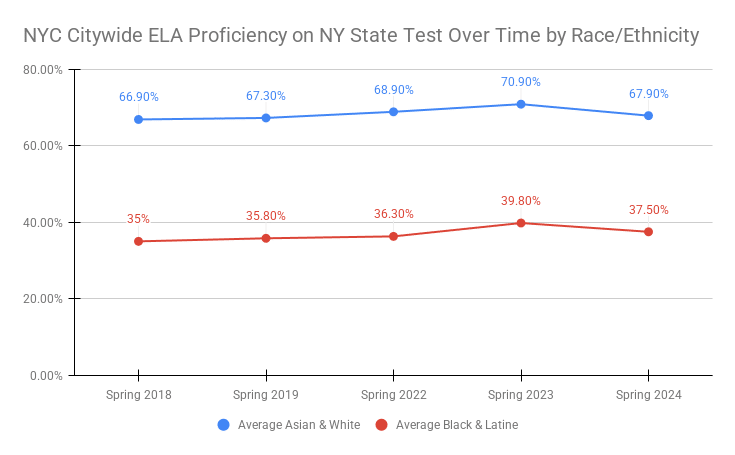
In New York City, racial disparities in ELA proficiency, as measured by the annual ELA state test, have been stubbornly persistent.
As indicated in Figure 1, the gap in academic performance between Black and Latine students and their Asian and White counterparts remained largely unchanged in the years prior to COVID-19 and in the years since. In spring 2018, for example, the gap between the average of Asian and White student proficiency and the average of Black and Latine student proficiency was 31.9 percentage points; in spring 2024, the gap was only slightly lower, at 30.3 percentage points.
Figure 1: NYC ELA Proficiency on NY State Test, Over Time, by Race/Ethnicity
When the TMNSI launched, Teaching Matters improvement coaches began by conducting empathy interviews with leaders, teachers, and students. Then, they trained teachers to conduct their own empathy interviews with students.
As the name implies, an empathy interview is one in which the interviewer seeks to understand how the interviewee experiences a problem without imposing their own judgment. It is a critical continuous improvement tool for understanding the perspectives and needs of all significant stakeholders.
Across the empathy interviews with students, one issue came up again and again: Students felt a lack of engagement in their learning and a lack of connection to their classroom.
While student disengagement is by no means a new problem, it was exacerbated by the fact that these empathy interviews were conducted during the COVID-19 pandemic, as classes were taking place online. Schools had also been required to adopt one of two prepackaged reading curricula as a condition for joining the TMNSI, and most students were, to put it mildly, not excited about the new curriculum.
Teachers at one of the TMNSI schools—Mott Hall V—experienced a serendipitous coincidence: While they were conducting empathy interviews, they were also reading Gholdy Muhammed’s Cultivating Genius as a staff. Muhammed identifies five pillars for curriculum design, one of which is identity. Teachers connected their students’ sense of disengagement to Muhammed’s insights into the importance of identity in learning.
The Mott Hall V teachers further paired Muhammed’s focus on identity with Louise Rosenblatt’s “reader response theory,” which identifies three types of textual connection: text-to-self, text-to-text, and text-to-world. The teachers hypothesized that they could raise student engagement by helping students make text-to-self connections through strategic questioning.
The new curriculum Mott Hall V had adopted when it joined the TMNSI included “Do Now” questions that teachers asked at the start of reading lessons. Do Now questions are intended to launch a lesson by getting students interested in the topic while ensuring they feel academically successful at the lesson’s onset.
Teachers at Mott Hall V worked with their improvement coach to design new Do Now questions that would help students make text-to-self connections.
Consider two identity questions that teachers incorporated into their prepackaged curriculum:
Question 1: In The Lightning Thief, Grover is being picked on and Percy, being a good friend, is willing to risk detention to protect/stand up for him. How far are you willing to go or what are you willing to risk to help out a friend?
Question 2: The idea of noise pollution is brought up in the novel. What contributes to noise pollution in your community? Does noise pollution bother you? Why or why not?
Do Now sentence-starters that improvement coaches provided to teachers include:
Do Now:
After Reading:
From fall 2021 to early winter 2022, 35 teachers across half of the 16 TMNSI schools implemented the identity change idea.2
Prior to the intervention, students completed the following:
At the end of the intervention, in March 2022, students completed a mid-year administration of the Panorama Student Survey. Additionally, at the end of the school year, students took the same ELA assessment in i-Ready or MAP Growth to see if they had met their annual growth goal.
In the second year of the TMNSI, improvement coaches realized that while they were sharing the identity question structure with all the schools, teachers were not equally diligent in adopting it. In order to track the effectiveness of the strategy, the improvement coaches developed an additional metric: “integrity of implementation.”
The improvement coaches measured integrity of implementation with a set of factors that they could easily rate on a scale of 1–5 during an observation, combined with data from student surveys. These factors included:
The TMNSI also created a separate set of success criteria that improvement science coaches could use in their collaboration with schools. Examples of this criteria include:
Coaches also look for the following student behaviors:
Using a four-point scale, improvement coaches reported back on teachers’ overall integrity in terms of implementing the identity change idea in the fall semester. For example, a teacher would be given a 4 if they shared the identity question with students as written, at the point in the lesson that it was suggested, with structured opportunities for written reflection and verbal discourse. They would be given a 3 if they provided the identity question to students, but did not offer additional opportunities for more robust discussion. They would be given a 2 if the identity question was not pre-planned and offered to students on the fly, with little to no structure for in-depth reflection as well as discussion with peers. Finally, they might receive a 1 if they posed the question to students with no evidence of pre-planning and did not allow for peer-to-peer reflections/exchanges.
These ratings yielded the distribution shown in Table 1.
Table 1: Distribution of Teacher Integrity Ratings when Implementing the Identity Change Idea
| Rating | Quantity of teachers | Quantity of students |
| 1 | 0 | 0 |
| 2 | 11 | 487 |
| 3 | 4 | 90 |
| 4 | 12 | 481 |
| Total | 25 | 1,058 |
For the purposes of the analysis, we treated ratings of 1 and 2 (or just 2 in this case) as having “low” integrity, and ratings of 3 or 4 as “high” integrity. As such, there were 11 teachers who implemented with low integrity and 16 teachers with high integrity.
Based on this bifurcation, we observed the following outcomes across the schools in our network implementing the identity change idea, and within Mott Hall V specifically.
The proportion of students who attained their growth goal was 7.5 percentage points higher (at a statically significant margin of p<0.05) among students whose teachers implemented the identity change idea with high integrity than among students whose teachers implemented it with low integrity.3
Table 2: Differences in Students’ Annual Growth Goal Attainment on End-of-Year Screener, by Teacher Integrity when Implementing the Identity Change Idea
| Category | % of students attaining annual growth goal across all seven schools |
| Students of teachers with low integrity of implementation | 59.8% |
| Students of teachers with high integrity of implementation | 52.3% |
| Difference | 7.5 points |
| Statistical significance | p=0.014 (p<0.05) |
There were statistically significant results in the expected direction for two of the six Panorama domains: Cultural Awareness and Action and Rigorous Expectations. In other words, students whose teachers implemented the change idea with high integrity increased their favorable perceptions of Cultural Awareness and Action and Rigorous Expectations by larger margins than did students whose teachers implemented the change idea with low integrity. Additionally, in the domain of Classroom Belonging there was a small though not statistically significant difference in the expected positive direction.
Table 3: Change in % Favorable Responses to Specific Panorama Domains, by Teacher Integrity when Implementing the Identity Change Idea
| Category | Count | Change in % favorability of Cultural Awareness and Action domain | Change in % favorability of Rigorous Expectations domain | Change in % favorability of Classroom Belonging domain |
| Students of teachers with low implementation integrity | 405 | 0.5 % points | 0.8 % points | -0.4 % points |
| Students of teachers with high implementation integrity | 379 | 6.1% points | 6.0% points | 1.3% points |
| Difference | 5.6% points | 5.2% points | 1.7% points | |
| P-values (statistical significance) | p=0.019 (p<0.05) | p=0.017 (p<0.05) | p=0.496 (not statistically significant) | |
Teachers and improvement science coaches conducted a second round of empathy interviews with students. In these, students shared that the questions allowed them to connect to the content—even in instances where they still found the curriculum to be “boring.”
It turned out that using the identity questions offered an additional benefit: Some teachers were inspired to further adapt some of the learning tasks in order to connect to students’ interests. For example, two teachers at Mott Hall V created a modified performance task for a portion of their English curriculum to have students analyze contemporary sung poetry (that is, song lyrics) that connected to the larger themes of the anchor text.
These findings highlight the powerful impact of integrating students’ identities into instruction. The statistically significant improvements in literacy growth, perceptions of cultural awareness, and rigorous expectations suggest that when teachers implement identity-affirming practices with integrity, students experience greater academic success and engagement. Additionally, the empathy interviews reveal that even when students find the curriculum uninteresting, the identity-based questions foster deeper connections to the content, reinforcing the importance of culturally relevant pedagogy in promoting student investment and learning outcomes.
We also learned that this effect doesn’t just work for students—teachers who were frustrated at being required to implement a prepackaged curriculum appreciated having the autonomy to come up with their own questions for students to answer. Just as focusing on text-to-self connections increased student engagement, providing autonomy increased teacher engagement.
In the fifth year of the improvement science grant, the priority is to continue supporting each school’s sustainability with continuous improvement science practices. Adopting the mantra of “low effort, high impact” has allowed schools to dabble in innovative change ideas such as launching small group instruction, gamifying vocabulary, and of course, integrating identity questions. Schools will complete a minimum of two Plan-Do-Study-Act (PDSA) cycles4 over the remaining period of support. Schools that adopted identity questions as their change idea in earlier years of the grant still reported using the process in existing practices and processes. We found that if school leaders prioritize and integrate the adoption of the change idea into larger school goals, the work becomes sustainable and teachers’ efforts are validated.
Gay, G. (2018). Culturally responsive teaching: Theory, research, and practice (3rd ed.). Teachers College Press.
Ladson-Billings, G. (1995). The dreamkeepers: Successful teachers of African American children. Jossey-Bass.Meyer, A. (May 6 2021). Improvement as a journey. Unboxed. https://hthunboxed.org/improvement-as-a-journey-going-the-distance-with-improvement-science