Zack Jaffe and Amiee Winchester are are alumni of the Improvement for Equity by Design Network at HTHGSE.
One of the key principles of continuous improvement is that you should spend a lot of time understanding a problem before you take action on it. This has its merits, but it’s not necessarily feasible in a large school district—saying, “Ok, we will definitely be taking action once we’ve studied the problem for a year” isn’t likely to land well with teachers, families, or students.
We certainly found this to be the case when we started doing continuous improvement work in our school district, Baltimore City Public Schools (BCPS). Like Goldilocks, we had to figure out the sweet spot. Our district community told us we were taking too long to understand the problem, and in any case, workable solutions to the most pressing problems had already been identified and just needed to be implemented. We could understand where they were coming from—a district can’t slam on the brakes just because some folks went to an interesting continuous improvement training. At the same time, we know there are good reasons why continuous improvement processes spend so much time on understanding the problem—if you implement solutions based on a faulty understanding of the problem, those solutions won’t transform the system or the outcomes it produces!
Finally, we had an insight that solved this dilemma for us: an improvement journey can start anywhere, simply by applying the principles of continuous improvement to whatever you’re already doing.
The tool we developed allows practitioners to apply improvement at any point in their journey, rather than being forced to start something new. It reinforces a continuous improvement mindset about the work you’re already doing, by turning whatever you were planning to try next into an experiment, and empowering you to interrogate your assumptions about what solutions will lead to improvement.
It’s that simple. No secret steps or potions needed. Wherever you find yourself on the road to solving a problem, figure out what data you can collect, reflect on what is and isn’t working, and voila! You’re doing continuous improvement!
The tool is available in three formats:
The benefit of the slide is that it feels very easy to use (you can even print it out and fill it in by hand at a workshop).This version of the tool is designed to drill into a specific change idea.
The benefit of the spreadsheet is that it makes it easier to actually track what you do (see figure 1 for an example of a filled-in tool).
The Google doc is a good in-between: more robust than the single slide, less involved than the spreadsheet.
Figure 1: A Filled-in Theory & Measures Tool
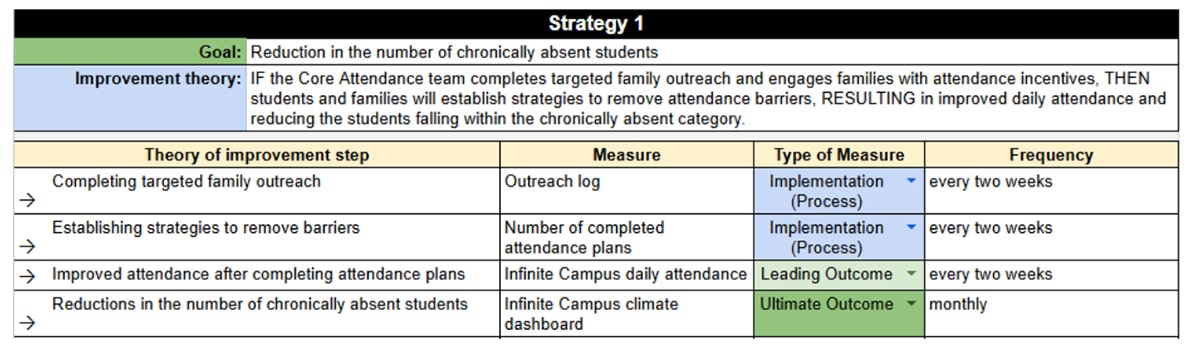
This tool can help with coaching an improver who has a change idea but hasn’t yet fleshed out a full theory of improvement or system of measurement. The goal is to help them think clearly about the chain of causality linking the action they will take and the ultimate outcome they hope to achieve. For example, a simple change idea to improve attendance might be to conduct home visits to students who are chronically absent. But why do we think this will work? Is it the threat of disciplinary action that will bring students back to school? Or does building closer connections to families improve attendance? What are the root causes underlying why students stay home? These are all different theories of improvement and would give improvers different ideas about how to measure success.
To coach improvers through the use of this tool, ask them to first articulate both their change idea and their ultimate outcome goal. Then, ask them to connect the dots between those two things. Ask clarifying questions whenever something seems vague or disconnected.
Second, ask them to identify possible measures of success for each step in their theory. These will be the “middle measures” that allow improvers to run rapid plan-do-study-act (PDSA) cycles, using implementation and leading outcome data to guide adaptations, rather than waiting for ultimate outcome data, which will often not be known for many months or years. It’s critical that they identify concrete sources of data (Who will collect it? How will it be collected? Where will it be housed?) and how often it will be collected.
We have a few tips for increasing buy-in and encouraging thoughtfulness when using this process:
Hinnant-Crawford, B. (2020). Improvement science in education: A Primer. Myers Education Press.