
Erin Asselin, Linzi Golding, and Melanie Gonzalez are members of the National Attendance & Engagement Meta Network at HTHGSE.
Since 2015 the Connecticut RISE Network has been facilitating school improvement networks, helping schools use data to learn and improve together. Last year, RISE partnered with 55 schools across six states to reach more than 35,000 students. Like many schools across the country, those in our network are increasingly concerned about chronic absenteeism, one of our main areas of focus for improvement.
Chronic absenteeism is a problem whether or not a student’s absences are excused or unexcused—if a child isn’t in school, they are missing out on all the benefits that come from being in school. A student is classified as chronically absent if they miss10 percent of the school year. This threshold is important because a student who misses this much school is at risk of a host of other academic (and life) issues. A 2024 literature review by Dr. Ben Daley of the High Tech High Graduate School of Education found the following:
Frequent absences in kindergarten have been found to be predictive of lower likelihood of reading proficiency by the end of third grade (Ginsburg, Jordan, & Chang, 2014; Bruner, Discher, & Chang, 2011) and lower achievement on test scores in fifth grade (Buehler, Tapogna, & Chang, 2012; Bruner, Discher, & Chang, 2011). Chronic absenteeism has been found to predict lower National Assessment of Educational Progress (NAEP) scores (Ginsburg, Jordan, & Chang, 2014), and lower rates of college persistence (Ginsburg, Jordan, & Chang, 2014).
We have found that while chronic absenteeism is an important measure for many reasons, it has one glaring limitation: Once a student has missed a certain number of days, there is no way to “fix” the situation until the following school year. That’s acceptable (in fact, necessary) for the purposes of data collection, but it’s disheartening if you work in a school and want every single one of your students to be successful, no matter how many school days they’ve already missed.
To understand what we mean, one must understand how chronic absenteeism is measured. In Connecticut, where the school year is typically 180 days, approximately 18 absences can mark a student as chronically absent for the year. This means that if a student misses 18 days of school in September, but the school works intensively with the student and their family to not miss a single day of school for the rest of the year, then the following summer, when the chronic absenteeism figures are published, that student will still be classified as “chronically absent.”
If your goal is to decrease chronic absenteeism rates at your school, one approach is to prioritize working with students who are at risk of becoming chronically absent rather than students who are already classified as such, because there is no opportunity for these students to improve using the chronic absenteeism measure. This is an important strategy, but we have found that relying exclusively on the chronic absenteeism measure can make it seem impossible for students to experience improvement once they hit the 18 day threshold. This does not sit well with teachers or administrators, who want to help every student succeed.
At RISE, we have developed the RISE Data Hub, which schools can use to track their improvement progress. The Data Hub tracks chronic absenteeism, but we have added an important measure: quarterly number of absences. For this measure, we split the school year into four quarters and track absences for each quarter, by student.
Tracking absences quarterly allows schools to spot trends and changes faster, whether they be something to celebrate or a student who needs more support. When we track the number of absences by quarter, just a few missed days in a row can trigger early intervention or celebration.
Schools have found that tracking absences quarterly enables teams to get ahead of students who are falling into a pattern that could lead to being chronically absent. It allows us to shift from reactive to proactive practices and interventions to ensure that students are celebrated for small improvements and continue to build strong habits. One RISE improvement coach, Kristen Negrón, shares an example of how students with improved attendance can be celebrated:
One of the schools I coach started an attendance challenge from now until the end of the school year. The teams review the quarterly number of absences data to identify students who have not had an increase in absences over the last week. These students earn coveted lunch time outside in the courtyard (a privilege usually reserved for upper class students). Those who miss no more than two days from now, in early April, until May 19th will earn a field trip, no matter their prior attendance.
First, divide the school year into four parts; these are your “quarters.” In Connecticut, the average school year is 180 days, so each quarter is 45 days long. Then, figure out how to count the number of absences during each quarter, for each student. Your school is already collecting this data (because teachers take roll every day) so this should be fairly straightforward.
Once you have your data, determine how best to share it. Our RISE Data Hub provides educators, counselors, and administrators with access to actionable, student-level data to facilitate immediate action. The RISE Data Hub has custom charts that use data pulled from student lists to create data visualizations. These are used to pinpoint wins and opportunities for improvement.
Depending on your intended purpose, you can choose from several approaches to analyzing attendance data. Each visual is designed to encourage specific educator actions. Below we have identified four ways to use attendance data to effectively celebrate and support students.
Student lists like that shown in Figure 1 show a student’s quarterly number of absences and average daily attendance. Each student’s number of absences is color-coded based on their risk level for chronic absenteeism. Green represents less than three absences, yellow equals three, and red stands for four or more and indicates students who are at risk of chronic absenteeism. This allows Data Hub users to easily identify students who are consistently in the yellow or red, and those who fluctuate throughout the year.
Figure 1: RISE Data Hub Student List with Simulated Student Demo Data
Note: The data snapshots have been pulled from the demo version of the RISE Data Hub and feature fictionalized data.
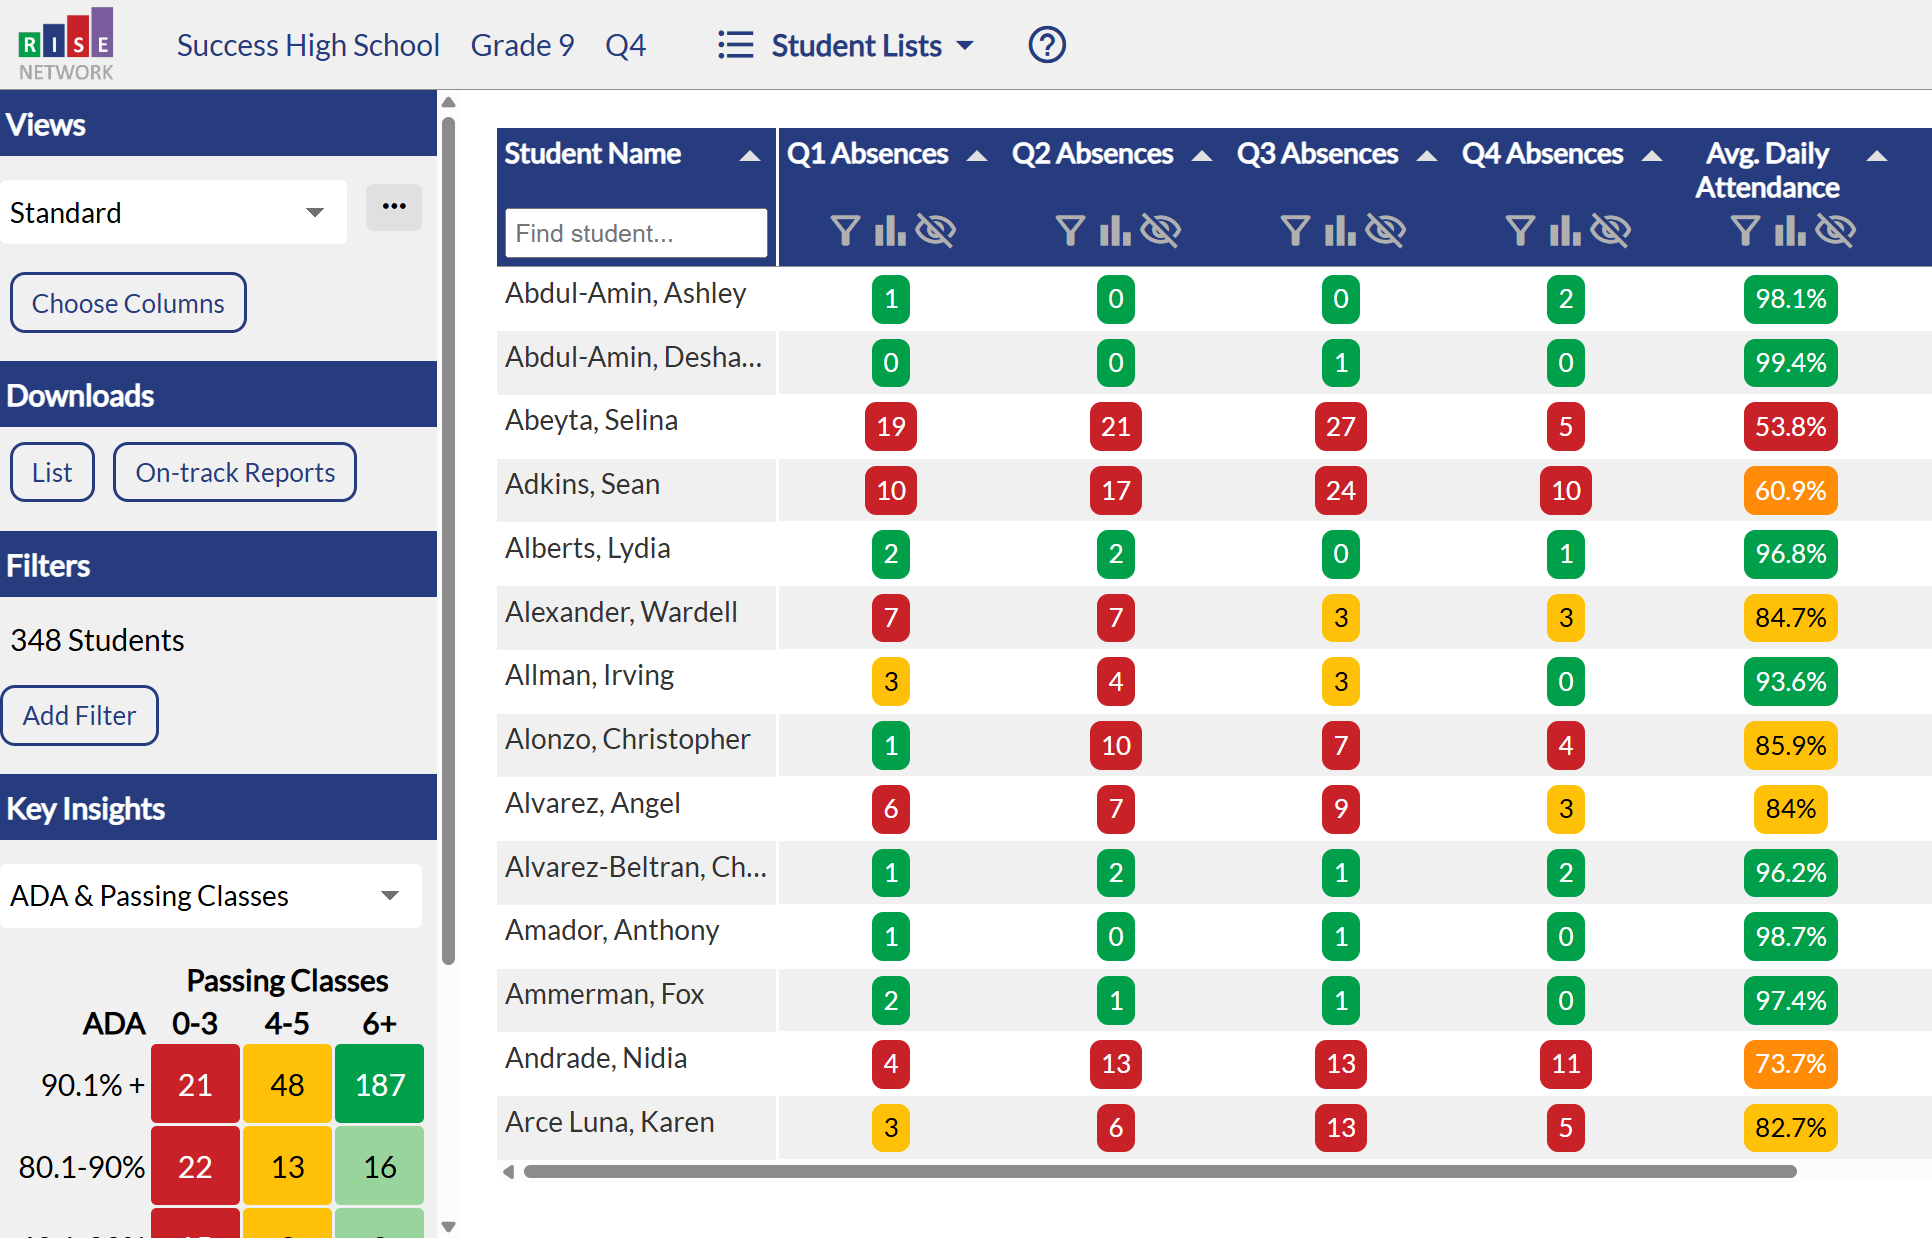
While the average daily attendance may fluctuate throughout the year, once a quarter ends, the number of absences freezes and can then be used as a baseline to measure improvements or declines in student absenteeism rates for the next quarter.
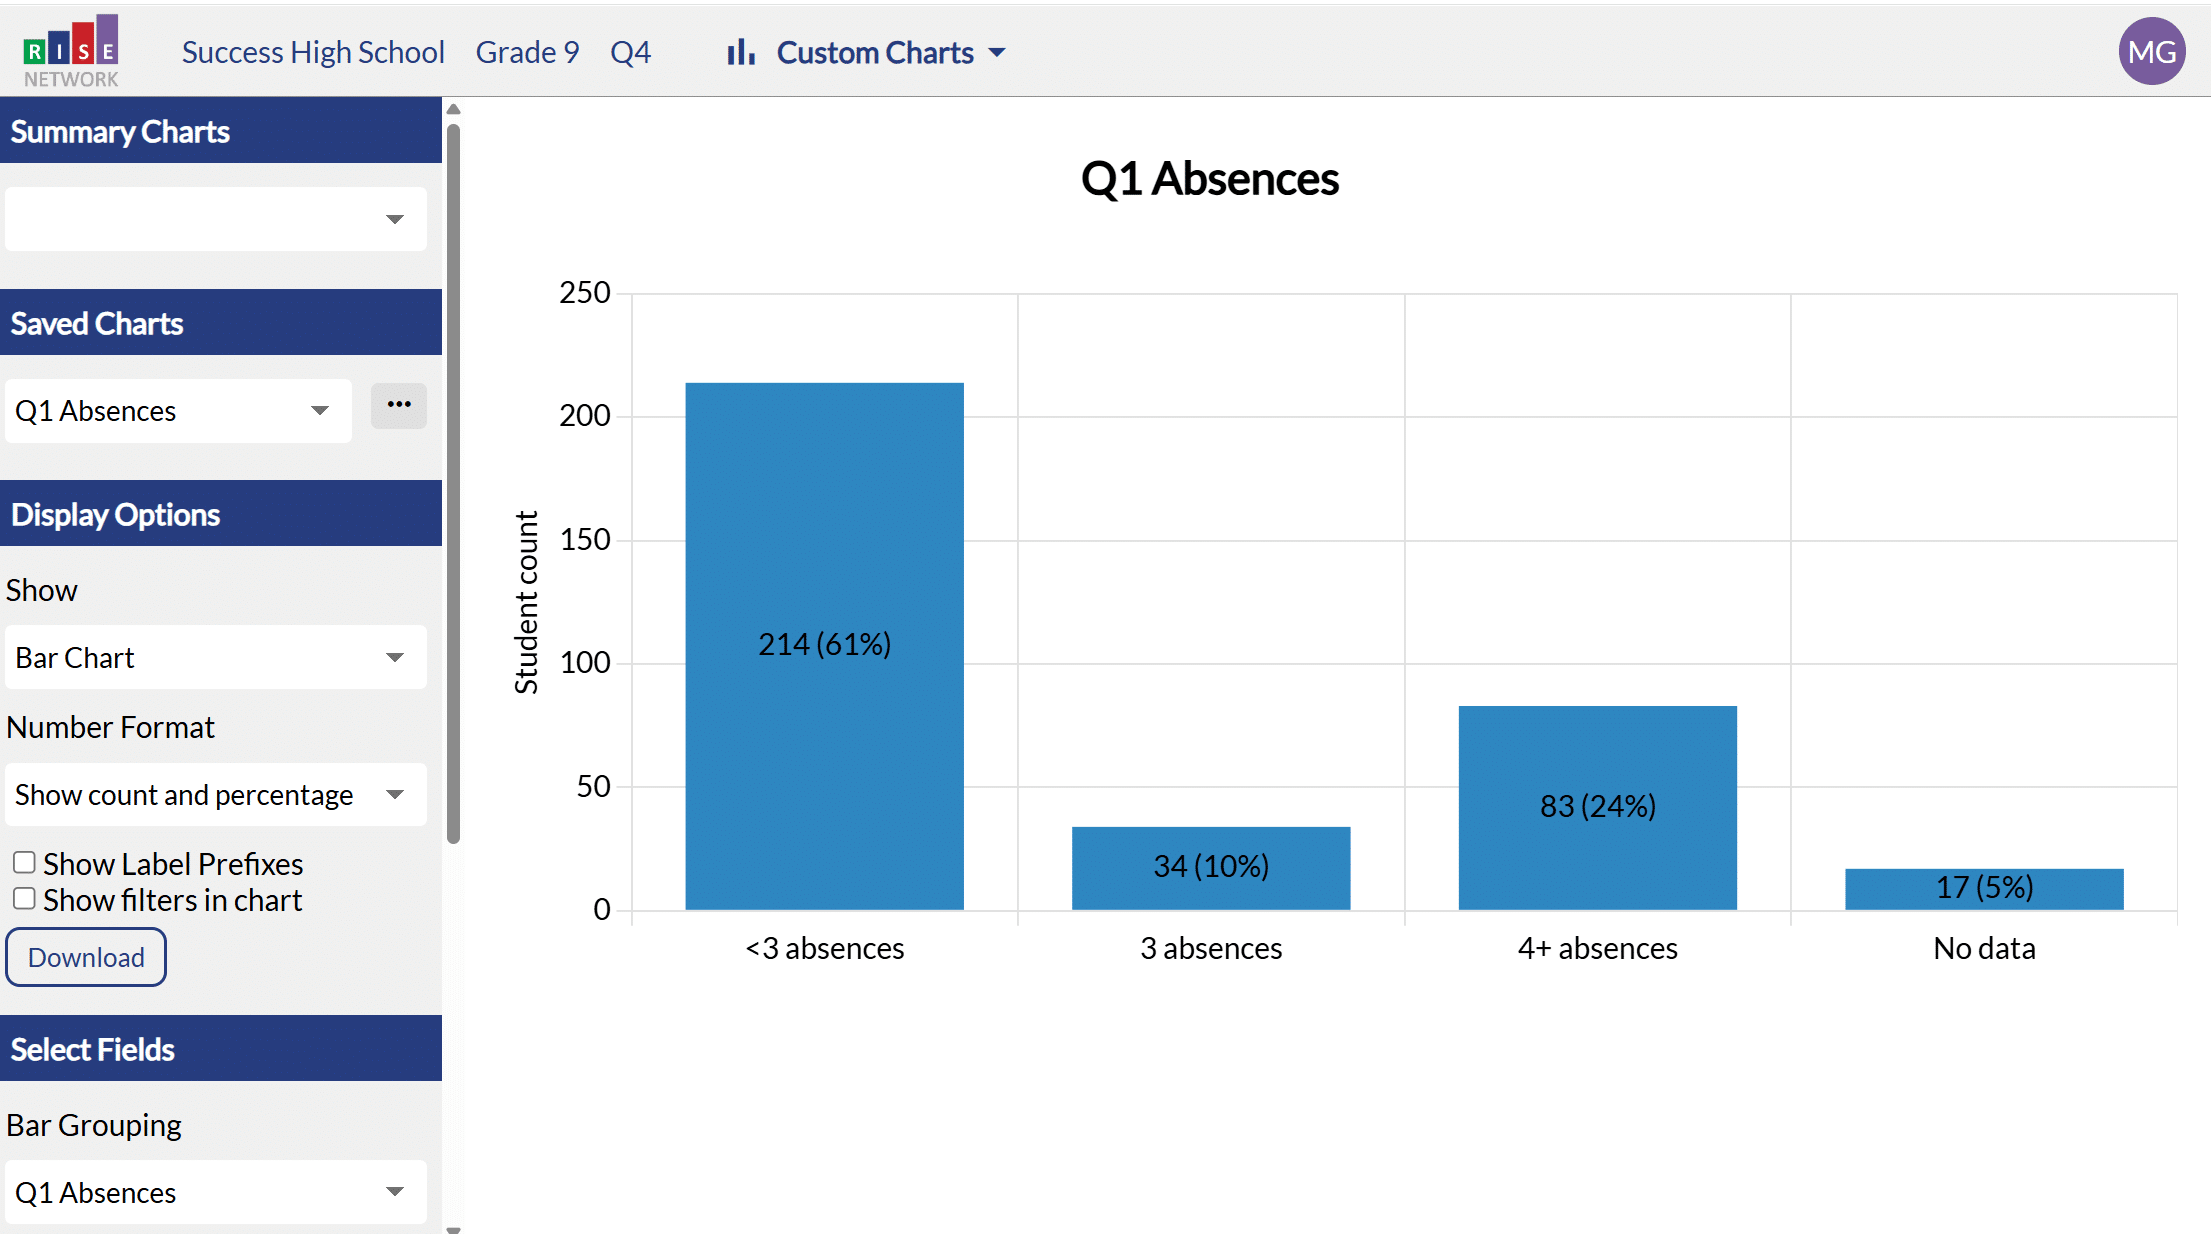
Through the RISE Data Hub, educators can identify quarterly student absence data by attendance band. For example, they can create a simple bar chart of Q1 absences to see the count and percentage of students who were in the less than three absences, three absences, and four or more absences categories. For example, Figure 2, shows how 24 percent of Success High School students were absent 4+ times. Hub users can then click on the bar and generate a list identifying those 83 students, whom school staff can communicate with and/or deliver interventions.
The graph shows summary level data for students across Q1, categorized by number of absences. We can then click on a category, for instance, “4+ absences,” to see student-specific information.
Figure 2: Q1 Attendance by Band with Simulated Student Demo Data
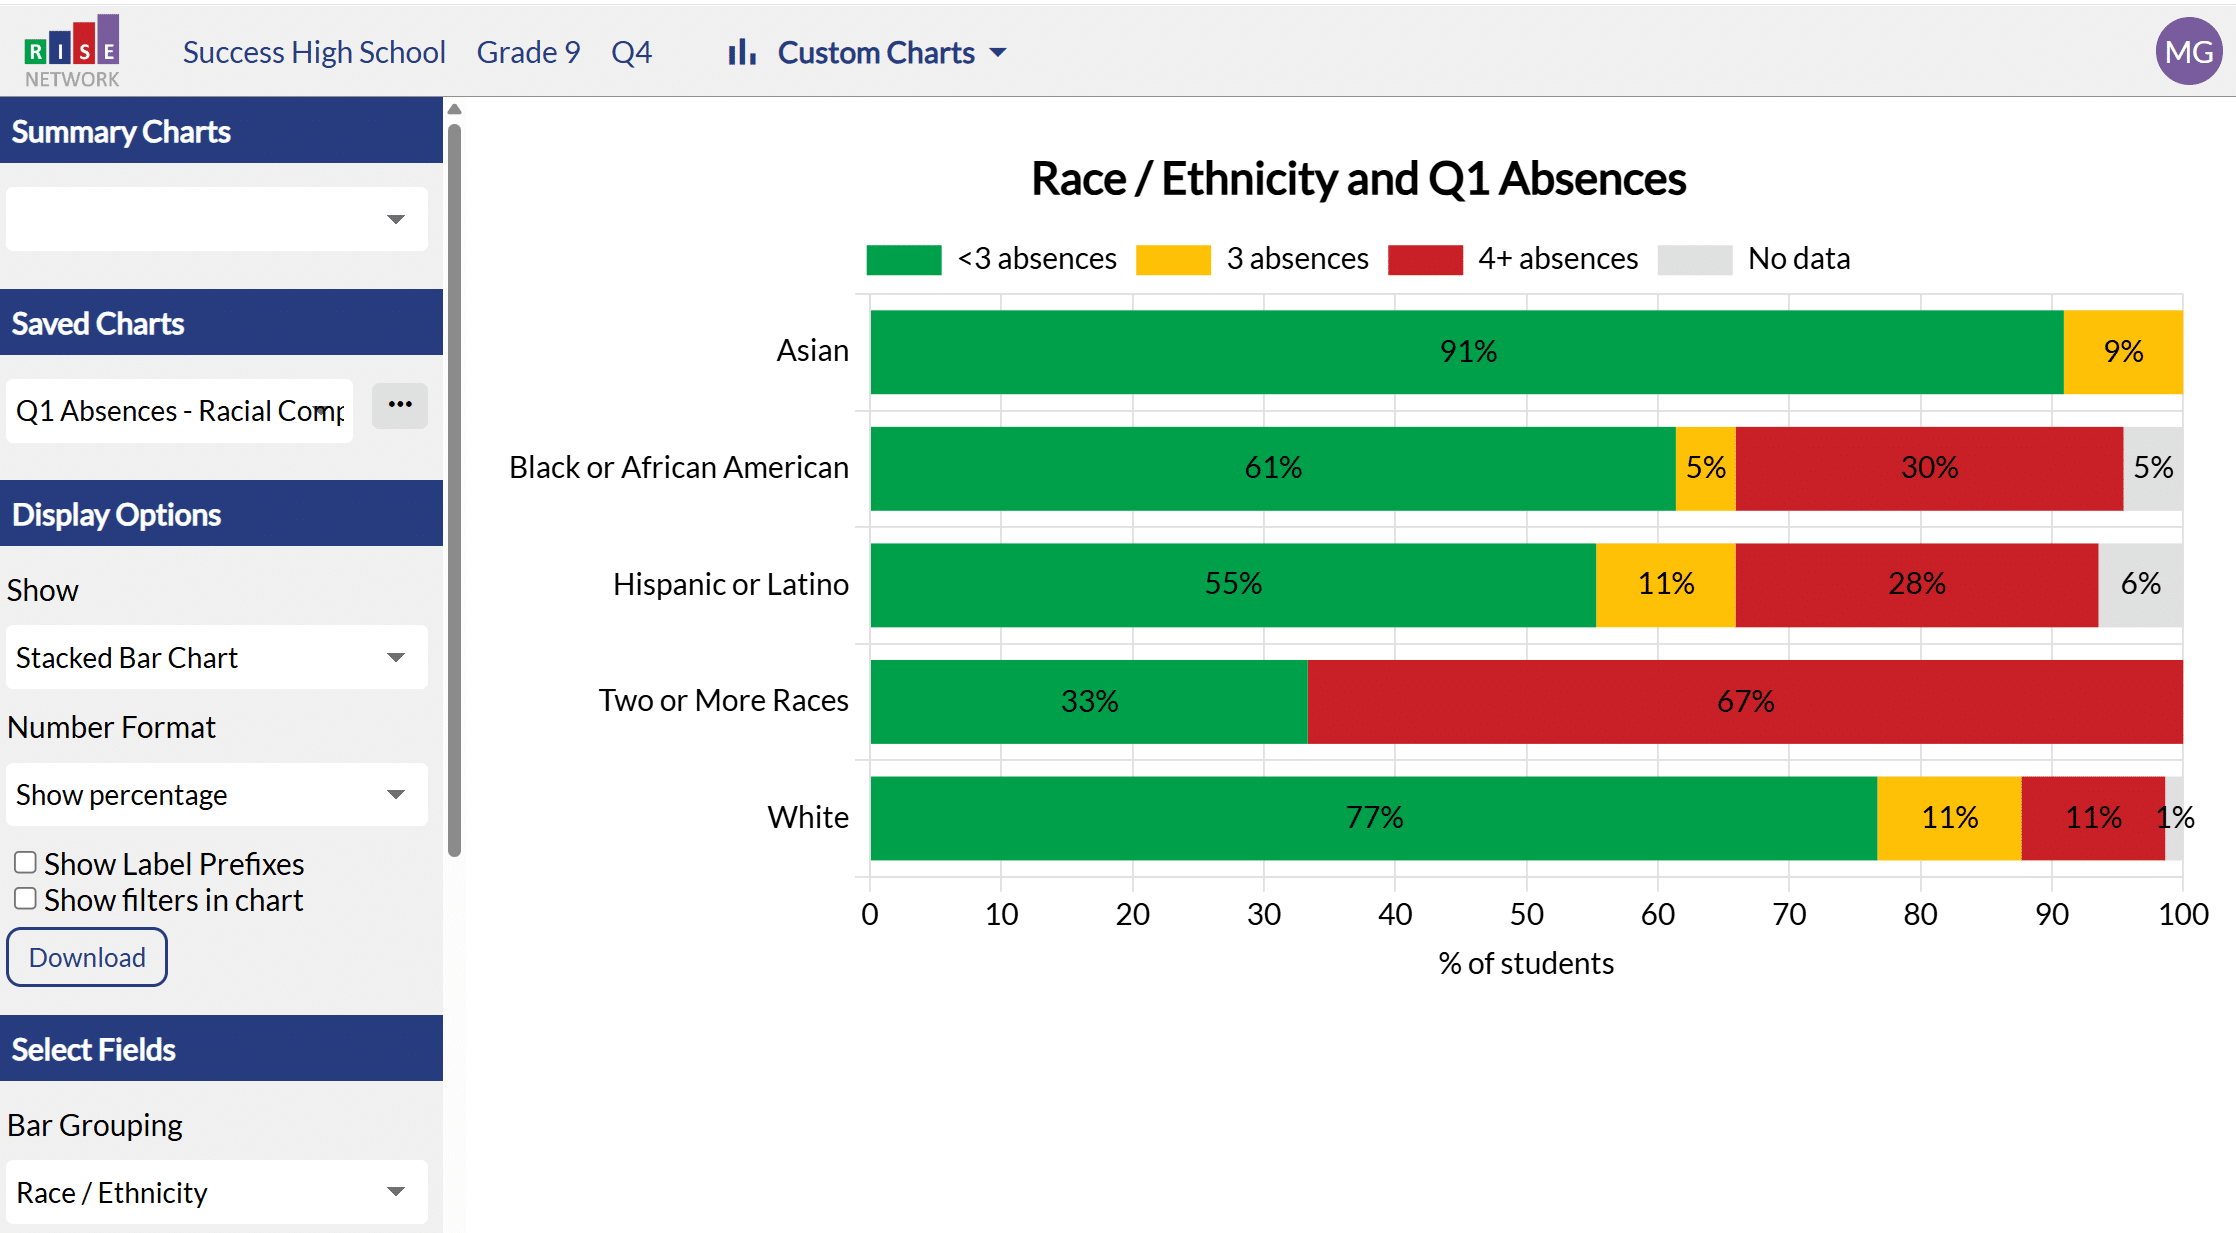
To assess subgroup differences in the number of quarterly absences, we can create a stacked bar chart. For example, Figure 3 shows students disaggregated by race/ethnicity. Notice the variation in the percentage of student groups that were absent four or more days: students of two or more races, Black students, and Latine student groups have greater proportions of students who were absent four or more days compared to their Asian and White peers.
Figure 3: Race/Ethnicity and Q1 Absences with Simulated Student Demo Data
If you want to be very nuanced with your data exploration, you might want to look at changes in the number of student absences from Q1 to Q2 to understand who improved their attendance habits, maintained their status, or had worse attendance. After identifying students within these classifications, you can then think about how to support students and caregivers, either with celebrations or interventions.
At RISE, we use the Q1 to Q2 number of absences to identify the following types of students:
The RISE Data Hub encourages us to realize that data is best used as a flashlight to illuminate a student’s successes and challenges, rather than as a hammer to punitively enforce compliance. The Data Hub allows educators to take a more strategic look at student data to inform targeted interventions, supports, and celebrations.
Using data in innovative ways like looking at quarterly changes in number of absences instead of relying solely on average daily attendance allows educators to test whether the changes they implement result in meaningful improvement that impacts student success. We invite you to think outside the box and find creative ways to use data to generate transformative change with the students in your school.